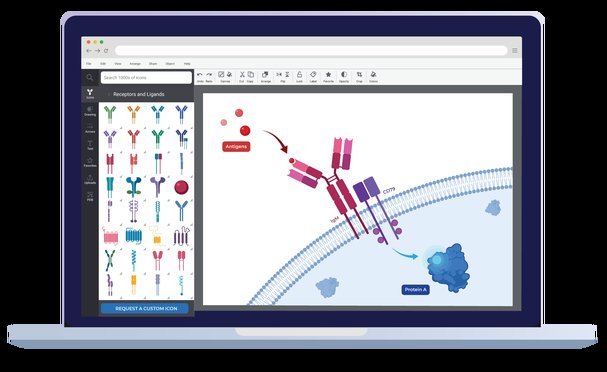
Preset icons and templates make it easy for scientists to create figures using the web-based tool BioRender.
Credit: Images created using BioRender.com
Drawing on experience to help scientists tell their stories
The BioRender web tool lets researchers easily create sophisticated scientific illustrations.
19 March 2019

Images created using BioRender.com
Preset icons and templates make it easy for scientists to create figures using the web-based tool BioRender.
Well-designed illustrations can help to clarify research in publications, grant applications and presentations. But reducing research to a simple visual representation is a skill few scientists are taught.
Popular tools for creating images, such as Microsoft PowerPoint and Adobe Illustrator, were not designed with scientific research in mind. As a result, even seemingly simple tasks — drawing a biochemical pathway, for instance — can take hours of painstaking work.
Enter BioRender, a browser-based illustration programme designed specifically for scientific illustration.
Shiz Aoki, cofounder and CEO of BioRender, which is based in Toronto, earned a master’s degree in medical and biological illustration from the Johns Hopkins University School of Medicine in Baltimore, Maryland. After graduation, she worked for National Geographic magazine, and launched a medical illustration firm called Anatomize Studios, which charges clients between US$1,000 and US$10,000 on a custom illustration, depending on the work involved.
Many academics cannot afford such rates, so try to go it alone. “It was really disheartening to see them using things like PowerPoint or Microsoft Paint to [document] these exciting findings, but aesthetically they looked like children’s crayon drawings,” says Aoki. BioRender fills this gap, she says.
Upon launching the software, users are presented with a canvas — either blank, or loaded with any of nearly 200 prepared templates, such as a blood vessel, protein translation, or the Krebs cycle. Menus and toolbars allow users to manipulate, share, and export their image, while a side panel allows researchers to add text, arrows, or select from thousands of pre-designed icons.
It is these icons that really put the ‘bio’ in BioRender — they include everything from cells and anatomic features, to nucleic acids, protein complexes, chemicals, and lab equipment. Users can drag the icons to the canvas; rotate, resize, group, label, and align them; change their colours; and so on. They can also upload their own images, request custom designs from the BioRender team, or create their own icons from molecular structures by providing a Protein Data Bank identifier.
The team developed BioRender with a focus on usability and flexibility, Aoki says. As a result, the software is stripped-down relative to other drawing tools. There are, for instance, no Adobe Illustrator-style “layers” in BioRender (though objects can be moved in front of or behind other objects). And though icons can be resized and recoloured, their fundamental shapes cannot be changed.

Images created using BioRender.com
A preview of the BioRender workspace.Figure out
BioRender went live in late 2017. Since then, the service has logged nearly 50,000 users. Aoki estimates that BioRender images have appeared in more than 50 journals to date, including titles in the Nature, Cell, and PLOS families.
Matthew Buechler, a postdoctoral researcher at Genentech in San Francisco, California, used BioRender to create an illustration for a Science article on the immunology of inflammation-driven red blood cell deficiencies, called cytopenias, which was published in January 2019. Working with his supervisor, Buechler sketched out some mock-up illustrations and then passed those to BioRender, which provided feedback — a perk of BioRender’s higher-tiered pricing plans.
The figure shows monocytes, a type of immune cell, maturing in the bone and traveling to the spleen. Users can zoom in for an explanation of how these cells differentiate into a cell type implicated in certain inflammatory cytopenias, revealing the protein–DNA interactions involved. Buechler created the figure in 30 minutes.
According to Aoki, the BioRender icon set focussed initially on immunology; since then, the company has expanded that collection to include cell and molecular biology, biochemistry, and agricultural biology. The company is now working to support animation, the ability to create icons that reflect specific DNA sequences and chemical structures, and the preparation of entire presentations.
BioRender is free for basic educational use, but a paid subscription is required to publish a figure. Academic paid subscriptions cost US$8/month for students (US$100/year); US$35/month for researchers; and US$99 for teams with five members. “It’s an essential tool,” says Buechler, who plans to continue using it when he opens his own lab. “This will be one of the first things that I make sure we have,” he says.